Introduction
Odontometric measurements are important in the determination of space discrepancies in the dental arches. In clinical orthodontics, odontometric measurements are done to determine the arch perimeter and total tooth mass.1, 2 Mixed dentition analysis is the difference in measurements between space present in the dental arch and required space required for accommodating the erupting permanent teeth in this period. Treatment of dental crowding and malocclusion is normally initiated after referral of a child at the age of 10-12 years, i.e. second transition stage of mixed dentition when upper incisors give appearance of bug teeth protruding outside due to tortious canine path of eruption, which leads to concern to parent and child. Hence, space analysis is utmost important step to be done during this stage for proper diagnosis and treatment planning. Maintaining good space allows many patients to obtain good occlusion and proper growth and facial development. Melgaco et al in 2007 conducted a study in Brazilian population based on study from Rio de janeiro, in which four permanent mandibular incisors and molars were used as predictor for estimated combined width of unerupted permanent canines and premolars. For this he assessed a linear regression equation. Hence, this study was conducted to assess and compare the applicability of linear regression equation by Melgaco’s analysis for mixed dentition.3 The present study was conducted to evaluate and compare the applicability of Melgaco's linear regression equation for mixed dentition analysis in the population of Panchkula district of Haryana state in North India.
Aims and Objectives
To calculate the sum of mesiodistal width of mandibular permanent 4 incisors and 2 first molars (SMI) and sum of mandibular permanent canines and all premolars (SCPM) in population of Panchkula.
To compare the SCPM Panchkula population SCPM of Brazilian population.
To compare actual SCPM of subjects from Panchkula with predicted values of SCPM calculated using Melgaco’s regression equation.
To compare gender based values of above parameters.
Materials and Methods
This study was done on study casts taken before treatment in 200 subjects whose age fell between 15 - 25 yrs who attended the OPD of Orthodontics department.
The patients with full complement of permanent dentition upto 2nd molars, with no previous history of orthodontic treatment were included in the study. The rotated teeth, fractured teeth, presence of proximal caries, occlusal attrition or with any alteration in shape and size and syndromic patients eg: CLP were excluded from the study.
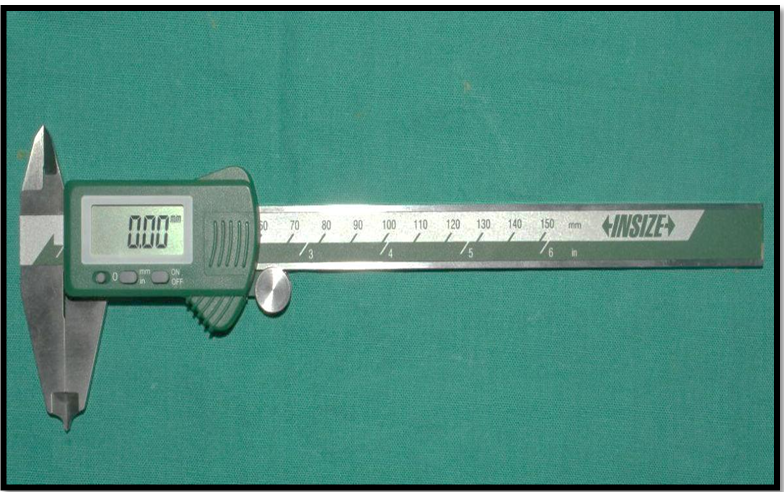
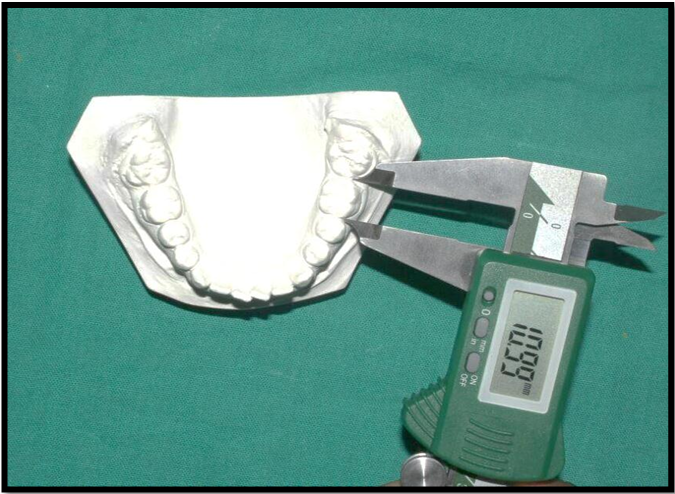
measured at thewidwidth area of contact point on proximal surfaces (Figure 1). Measurements were taken parallel to occlusal surface and perpendicular to the long axis of the tooth (Figure 2).
Following regression equation was applied as given by Melgaco"s3
Y = a+bX in which
Y (dependent variable) = the predicted sum of mesiodistal widths in millimeters of the mandibular permanent canines and first & second premolars on both sides.
The constant a is the y intercept, and the constant b is the slope of the regression.
Y = 7 + 0.824X (for male patients)
Y = 9.2 + 0.766X (for female patients)
Y = 6.55 + 0.829 (for total population)
Results
Data was analyzed using SPSS (Statistical Package for Social Sciences) software version 22.0 (SPSS Inc., Chicago, Illinois, USA) and MS Excel. The interobserver and intraobserver reliability error was calculated using correlation coefficient from 20 randomly selected models and were found to be 0.917 and 0.910 respectively, showing consistency of the tooth measurements. Descriptive statistics was then compiled. Paired and unpaired t- test were applied to find the significance of difference for both males and females (Table 1). Spearman rank correlation test was done for correlation analysis.
Table 1
Distribution of subjects according to the gender
|
Gender distribution |
Number of cases |
Percentage |
|
Males |
65 |
32.50% |
|
Females |
135 |
67.50% |
-
Determination of mean values, mean difference and standard deviation in mm for sum of mesiodistal widths of the mandibular permanent first molars and incisors (SMI) and the sum of mesiodistal widths of permanent canines and premolars (SCPM) on both sides of mandibular arch in population of Panchkula district (Table 2).
The value of SMI was found to be 44.16± 2.04 mm in males, 43.20± 2.46 mm in females and 43.51± 2.37 mm in overall population.
SCPM was found to be 40.62 ±2.07 mm in males, 39.91 ± 2.34 mm in females and 40.14 ± 2.27 mm in overall population.
Difference between SMI and SCPM was found to be 3.53 ± 1.91 mm in males, 3.29 ± 1.70 in females and 3.37 ± 1.77 mm in overall sample population. p value in males, females and overall sample population was found to be ≤0.001** which is statistically highly significant.
-
Comparison between actual values of sum of combined mesiodistal width of permanent canines and premolars (SCPM) in Panchkula population with actual values of sum of combined mesiodistal width of permanent canines and premolars (SCPM) in Brazilian population (Table 3).
The mean SCPM was found to be 45.12±2.45 in males, 43.40±2.45 in females and 44.26±2.46 in overall Melgaco’s Brazilian sample population.
The SCPM was found to be 40.62±2.07 in males, 39.90±2.33 in females and 40.14±2.27 in overall Panchkula sample population.
The SCPM was found to be 4.49 in males, 3.49 in females and 4.12 mm in case of Brazilian and Panchkula sample population. The p value was found to be 0.035* in males, 0.039* in females and 0.052* between Brazilian and Panchkula sample population which is statistically significant.
-
Determination of predicted values of mesiodistal width of mandibular permanent canines and premolars (SCPM) with Melgacos’ regression equation and its comparison with actual values (measured) of sum of combined width of permanent canines and premolars (SCPM) in population of Panchkula district (Table 4)
The SCPM according to Melgacos equation was found to be 43.38 ± 1.68 mm in males, 42.29 ± 1.88 mm in females and 42.86 ± 1.95 mm in overall sample population.
The SCPM was found to be 40.62 ± 2.07 in males, 39.90±2.33 in females and 40.14 ± 2.27 in overall sample population.
The difference between predicted (according to Melgaco’s equation) and actual sum of combined widths of permanent canines and premolars on both sides of arch (SCPM) and was found to be 2.75±1.77 mm in males, 2.38±1.55 mm in females and 2.71±1.63 mm in overall sample population. The p value in case of males, females and overall sample population was found to be ≤ 0.001*** which is statistically very highly significant.
-
Comparison of gender difference between predicted and actual sum of combined width of permanent canines and premolars (SCPM) in population of Panchkula district (Table 5)
The SCPM according to Melgaco‟s equation13 was found to be 43.38 ± 1.68 mm in males, 42.29 ± 1.88 mm in females.
The SCPM according to measurements on dental study models was found to be 40.63 ± 2.07 in males, 39.91 ± 2.33 in females.
The p value was found to be 0.007*** (statistically very highly significant) and 0.036* (statistically significant) for predicted and actual sum of combined widths of permanent canines and premolars on both sides of arch (SCPM) respectively, for males and females in sample population.
Table 2
Mean values, mean difference and standard deviation in mm for SMI and SCPM in population of Panchkula district
Table 3
Comparison of actual values of SCPM in population of Panchkula district with Brazilian population
Table 4
Comparison between predicted values using melgaco’s regression equation and actual values of SCPM in Panchkula population
Table 5
Showing comparison of actual and predicted values of SCPM between males and females in Panchkula population
|
|
Predicted SCPM |
Actual SCPM |
|||||
|
|
Mean |
SD |
P value |
Sig. |
Mean |
SD |
P value |
|
Male |
43.38 |
1.68 |
0.007 |
Sig. |
40.63 |
2.07 |
0.036 |
|
Female |
42.29 |
1.88 |
|
|
39.91 |
2.33 |
|
Hence, the following regression equation was derived for Panchkula population,
For males is Y=15.005+0.580X,
For females is Y=9.134+0.712X
For overall (males and females) is Y= 10.458+0.682X.
Discussion
The aim of the study was to derive predicted values for combined mesiodistal widths of permanent canines, first and second premolars for population of Panchkula district according to Melgaco‟s mixed dentition analysis and to further compare it with the actual widths of permanent canines and premolars.
Mixed dentition analysis is imperative for the diagnosis and timely intervention of arch length discrepancies. It becomes fundamental in determining the treatment plan which might involve serial extractions, tooth eruption guidance, space maintenance, space gain or monitoring of occlusion.4
Melgaco’s prediction equation was based on study conducted on Brazilian population, so the accuracy of this method is questionable when applied to population of different race, ethinic origin or in different geographic location. Studies on various other populations have proved that these methods of mixed dentition analysis either overestimate or underestimate the actual widths of permanent canines and premolars.
Comparison between predicted and actual values with Melgaco’s regression equation for the sum of combined mesiodistal width of permanent canines and premolars (SCPM)
Our results were not in concordance to Melgaco’s original study for Brazilian population3 where the difference between predicted and actual sum of combined widths of permanent canines and premolars (SCPM) was found to be 0.02±1.49 mm in males, 0.04±1.36 in females and 0.00±1.44 in overall population.
Our results were in concordance to the results of study by Rasool et al in 2008 on study models (100 males & 100 females) to check the applicability of Melgaco’s equation in Islamic population of Islamabad, Pakistan. They found the difference between predicted and actual sum of combined widths of permanent canines and premolars (SCPM) to be 0.616±2.31 mm in males, 0. 680±2.59 mm in females and 0.648±2.45 mm in overall sampled population.
Comparison of gender differentiation in predicted and actual values of SCPM
In our study, the mean predicted sum of combined width of permanent canines and premolars on both sides of arch (SCPM) according to Melgaco’s equation3 was found to be 43.38 ± 1.68 mm in males, 42.29 ± 1.88 mm in females. Whereas, the mean actual sum of combined width of permanent canines and premolars on both sides of arch (SCPM) was found to be 40.62 ± 2.07 in males and 39.90±2.33 in females, respectively. Our study was similar to previous studies where they found gender difference in SMI as well as SCPM.
In Melgaco’s study in 2007, the mean predicted sum of combined width of permanent canines and premolars on both sides of arch (SCPM) was found to be 45.14 ± 1.95 mm in males and 43.44 ± 1.66 mm in females. Whereas, the mean actual sum of combined width of permanent canines and premolars on both sides of arch (SCPM) was found to be 45.12 ±2.45 in males and 43.41±2.14 in females.5
Orthodontic literature reveals that tooth size differs among gender with males having larger teeth than females and tooth size difference among males and females in Peruvian, Senegalese, Croatian, Brazilian, Southern Chinese, Turkish, Italian, Uganda, Indian and Pakistani population reported. Several researchers have not considered sexual dimorphism in their population. In our study tooth size difference was significant among genders with males having larger teeth than females.5
Correlation of actual (SCPM) with predicted (SCPM) by other studies for males, females and overall sample in different population
In our study, the correlation coefficient (r) is 0.572 for males, 0.750 for females and 0.711 for overall sampled population. The correlation coefficient (r) in males was less when compared to other studies in which they predicted sum of combined width of canine and premolars on the basis of mandibular incisors like Tanaka Johnston (r= 0.65) in 1974 for white Americans, Frankel et al.6 (r= 0.79) in 1986 for Black Americans; Durgekar et al.7 (r= 0.62) in 2009 for Lingayats in Belgaum ; Philip et al.8 (r= 0.68) in 2010 for Punjabi population; Shah et al.9 (r= 0.69)in 2013 for Gujrati population. The correlation coefficient (r) in males was less when compared to other studies in which they predicted sum of combined width of canine and premolars on the basis of combined width of mandibular incisors and mandibular first molars like Melgaco’s et al.3 (r= 0.79) in 2007 for Brazilian population Rasool et al.8 (r= 0.71) in 2008 for Islamabad population, Shah et al.9 (r= 0.71) in 2013 for Gujrati population.
This difference of the results between our study and Melgaco‟s et al. study could be due to sample size, racial and ethnic difference among the two population. The correlation coefficient (r=0.711) for overall sampled population suggests that SMI is a better predictor for estimating the sum of mesiodistal widths of permanent canines and premolars (SCPM) for the present population. It might mean that around 70% of the polygenes that determine tooth size are shared between the mandibular incisors and molars and the canines and premolars.
Comparison of linear regression equations for predicting mesiodistal widths of permanent canines and premolars in various studies for males, females, and combined overall subjects.
Ballard and Wylie et al.10 (1947) for Caucasian population, Hixon and old father (1958) for caucasian population, Tanaka and Johnston1 (1974) for Caucasian population, Ferguson et al.11 in American black population (1978), al- Khadra et al.12 (1993) for Saudi Arab population, Lee Chan S et al.13(1998) for Asian American population, Nourallah et al.14 (2002) in Syrian population gave a regression equation for both males and females as X=9.41+0.527Y, X=0.6474 Y+ 3.493, Y =9.18+0.54Y, Y = 9.9350+ 0.5288X, Y = 8.6+ 0.55X, Y = 7.5+ 0.6X, Y = 4.93+ 0.52X respectively. Y represent the sum of mesiodistal widths of permanent canines and premolars in mm (both sides) whereas X is the sum of the mandibular permanent first molars and incisors in mm (both sides).
Frankel and benz et al.6 (1986) for American Black gave regression equation for males Y = 0.72X+ 5.97 and for females Y = 0.49 X+ 10.34 and for both Y = 0.64X+ 8.30; Yuen et al.15 (1998) for Hong Kong chinese population gave regression equation for males Y = 8.22+ 0.58X and for females Y = 6.66+ 0.64X ; Diagne et al.16 (2003) for Senegalese population gave regression equation for males Y=5.45+ 0.72X and for females Y=8.74+ 0.56X and for both Y=5.67 + 0.70 X; Melgaco et al.17 (2006) for white Brazilian population gave regression equation for males Y=8.9+ 0.58 X and for females Y=9.2+ 0.55X.
Altherr et al.18 (2007) gave regression equation for males Y = 0.59X+ 8.47 and for females Y = 0.65X+ 6.20; Melgaco et al.3 (2007) for Brazilian population gave regression equation for males Y=7+ 0.824X and for females Y = 9.2 + 0.766X and for both Y = 6.55+ 0.829X; Uysal et al. (2009) for Turkish population gave regression equation for males Y = 4.17+ 0.73X and for females Y = 4.51+ 0.71X and for both Y = 3.74+ 0.75X; Pawar and Bhat19 (2016) for Indian population gave regression equation for males Y = 0.770X + 8.761 and for females Y = 0.632 X + 14.07 and for both Y = 0.792X + 7.4 respectively.
In our study, equation derived from logistic regression for Panchkula Population for males is Y=15.005+0.580X, for females is Y=9.134+0.712X and for overall (males and females) is Y= 10.458+0.682X.
Conclusions
The simplified equations proposed are easy to use and seem to be a practical and precise method for predicting the mesiodistal with of unerupted canine and premolars By including mesiodistal widths of first mandibular molars into sum of mesiodistal widths of mandibular incisors gives more accurate values of unerupted canine and premolars as compared to other methods available.
The regression equations proposed in this study are good prediction method to determine the widths of unerupted permanent canine and premolars. Hence, the new equation derived from logistic regression for Panchkula population will add an adjunct in mixed dentition analysis and proper diagnosis and treatment planning.