- Visibility 168 Views
- Downloads 24 Downloads
- DOI 10.18231/j.ijohd.2024.034
-
CrossMark

Consistency of centrographic analysis in assessing different skeletofacial morphologies in sagittal plane
- Author Details:
-
Harinder Kaur
-
 Shruti Mittal *
-
Astitav Mittal
-
Prerna Hoogan Teja
-
Mahak Gagain
-
Gunjan Aneja
Introduction
A desirable goal for the clinician is to identify the morphological and development uniqueness of a person.[1] The conventional cephalometrics have used methods that numerically compare a finding with pre-established norms.[2] J.S. Johnson (1960), an English orthodontist introduced the application of centroids to the evaluation of harmonious balance of cranial and facial structures. By definition, centroid represents the centre of mass or gravity of a two-dimensional area or a three-dimensional volume. It is a precise point representing the mean of a myriad of variations.[3] Leonard Fishman, introduced the centrographic analysis (CGA), which is a non-numeric, centroid-based analysis for evaluation of skeletal and facial form.[2] The present study was conducted to evaluate the applicability and consistency of centrographic analysis by comparing it with conventional cephalometric analysis to determine the skeletofacial morphology in sagittal plane.
Aim and Objectives
To evaluate and compare the skeleto-facial morphological parameters in sagittal plane of centrographic analysis with conventional cephalometric analysis in different malocclusion groups.
Materials and Methods
From the patients visiting the OPD of department of Orthodontics & Dentofacial Orthopaedics for Orthodontic treatment 196 individuals (115 females & 81 males, age 17-26 years) who fulfilled the selection criteria were included in the present study. All individuals were of North Indian origin, having full complement of teeth, with no previous history of orthodontic treatment, no history of extraction or missing teeth. Each lateral cephalogram was manually traced on lead acetate paper on an X-ray viewer. The tracing was analysed separately with conventional cephalometric method and with centrographic analysis. Cephalometric measurements were recorded to assess sagittal relationship and soft tissue characteristics.[4], [5], [6], [7], [8], [9]
Analysis assessing sagittal skeletal relationship
Conventional cephalometric analysis
To assess the sagittal skeletal relationships by conventional cephalometric analysis angles SNA, SNB, ANB, Beta angle & Wits Appraisal were measured and the subjects were classified into three groups e,g Skeletal class I, class II and class III malocclusion. To assess soft tissue balance Ricketts E line and Steiner’s S line were assessed. All the readings of the conventional method were evaluated according to the cephalometric norms of north Indian origin.
Centrographic analysis
The Centrographic analysis was done as described by Fishman,[1] for skeleto-facial morphological assessment in sagittal plane and for soft tissue lip chin balance evaluation in profile view.[10], [11], [12]
Assessment of sagittal jaw relationship
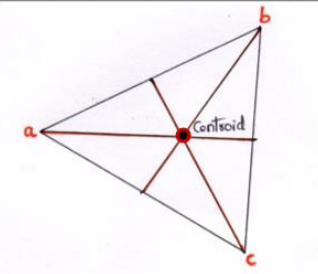
Construction of centroid
For the construction of centroid, a triangle abc is drawn ([Figure 1]). Median line is obtained by connecting the vertex to the opposite midpoint. Centroid is obtained by the intersection of two or three median planes.
Five points (S, N, Ba, A and Pog) and four lines (S-Na, Na-Ba, Ba-A and Ba-Gn) were drawn on the x-ray tracing for analysis.
Construction of triangles in lateral cephalogram
Cranial Centroid : Cranial triangle (Ba-S-Na)
Facial Centroid : Facial triangle (Ba-Na-Gn), Total Face
Upper Centroid : Upper facial triangle (Ba-Na-A), Upper Face
Lower Centroid : Lower facial triangle (Ba-A-Gn), Lower Face ([Figure 2], [Figure 3])
Construction of centroid plane
The centroid for the corresponding triangles are obtained. Then the centroid plane is constructed by drawing a perpendicular to Ba- A plane through facial centroid.
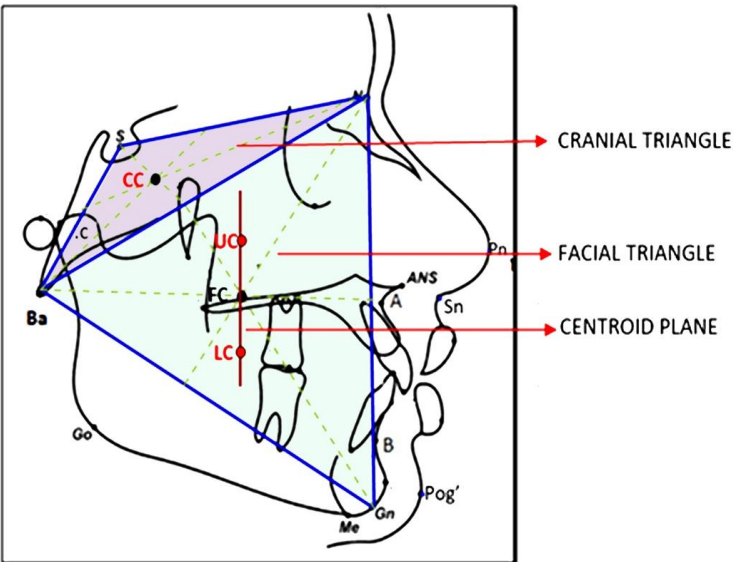
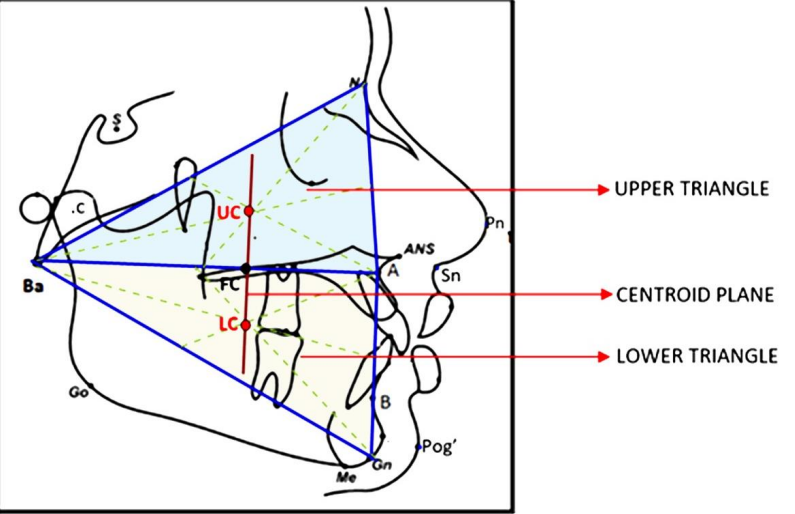
The antero-posterior position of the upper centroid (centroid of triangle Ba-Na-A) that represents upper face and lower centroid (centroid of triangle Ba-A-Gn) that represents the lower face, with respect to the centroid plane were studied for evaluating sagittal relation of upper face (maxilla) to lower face (mandible) In centrographic analysis for evaluating sagittal discrepancy, the relation of upper centroid and lower centroid in relation to centroid plane is seen. In class I condition, upper centroid and lower centroid falls on the centroid plane. whenever there is a deviation, anterior or posterior of upper centroid or lower centroid from the centroid plane, the skeletal pattern is diagnosed as class II or class III.
Soft tissue assessment
Cephalometric analysis ([Figure 4])
E Line: A line drawn from the tip of the nose to soft tissue pogonion. (Upper Lip to E line: -2 to-4 mm. Lower lip to E line: - 2 to 0mm)[9]
S Line: A line drawn from soft tissue pogonion to the midpoint of the S- shaped curve between subnasale and nasal tip. (Upper and Lower lip should lie on the S line. Lips lying behind this reference line are too flat, while those lying anterior to it are prominent)[6]
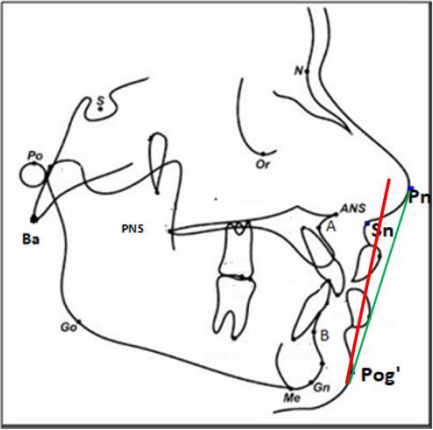
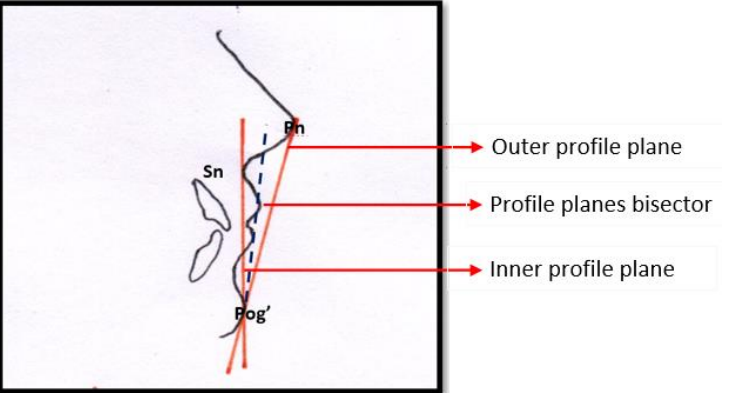
Centrographic analysis ([Figure 5])
Two soft tissue profile planes[13] were drawn:
Inner profile plane : Soft tissue Pogonion to Sub nasale
Outer profile plane : Soft tissue Pogonion to Nasal tip
A desirable relationship is described as both lips being positioned relatively equal within the space between the two planes at rest position and in occlusion. In the present method, we drew an angle bisector to subnasale-soft tissue pogonion-nasal tip angle and then measured upper and lower lip projection to bisector. The lip is said to be in balance and harmony if both upper and lower lip touches this bisector line.
Statistical analysis
All data and measurements, obtained from this study, were collected, tabulated, and statistically analyzed using the statistical package for social science software, version 20. To test the reliability of the cephalometric and centrographic measurements, 20 lateral cephalograms were randomly selected, retraced and reanalysed for the second time by the same observer and a second observer after four weeks interval to calculate the intra-observer and inter-observer errors respectively by applying paired ‘t’ test. X2 test (Pearson chi-square statistics) revealed statistically insignificant differences between each of the two readings, showing consistency of measurements. After x2 has determined significance, Cramer’s V was applied to determine strengths of association with values varying from 0 (corresponding to no association) to 1 (complete association)
Results
This study was conducted on 196 subjects which were categorized as three categories i.e. total sample subjects and after gender distribution into female and male subjects to study if any variation existed among these. Then each category i.e. total sample, female sample and male sample were skeletally divided i.e. sagittally into further groups of skeletal class I, II and III.
Assessment of skeletal pattern in sagittal plane was done on
Total subjects
Females
Males
Comparison of division of total sample sagittally
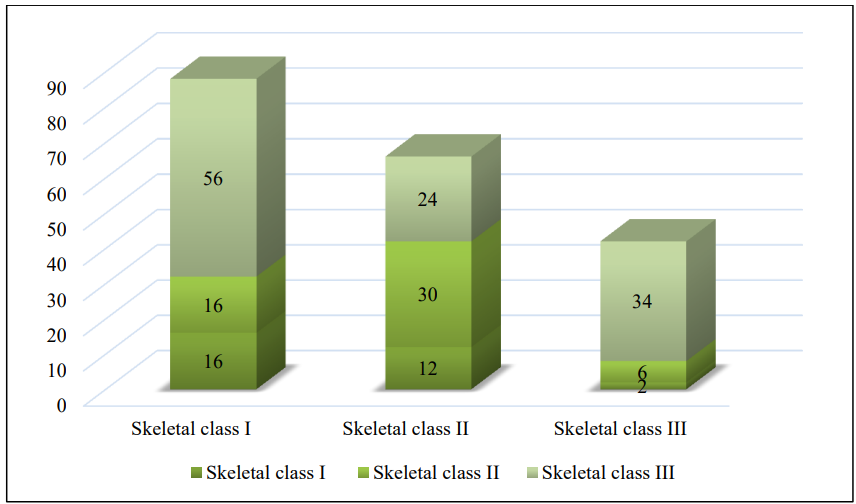
When total sample were grouped sagittally on the basis of both Cephalometric and Centrographic analysis, ([Table 1]) showed statistically significant results (P value - 0.000). The coincidence between the two methods in grouping the subjects sagittally is 41.83% of the sample.
|
|
Centrographic Method |
|
|||||
|
Cephalometric Method |
Sketal class 1 |
Sketal class 2 |
Sketal class 3 |
Total |
X2 |
P value |
Cramer’s V test |
|
Sketal 1 |
13 |
11 |
39 |
63 |
20.102 |
0.000 |
0.226 |
|
Sketal 2 |
15 |
35 |
41 |
91 |
|||
|
Sketal 3 |
2 |
6 |
34 |
42 |
|||
|
Total |
30 |
52 |
114 |
196 |
When female and male sample were grouped sagittally on the basis of both Cephalometric and Centrographic methods, showed statistically significant results (P value- 0.011) in females and (P value- 0.017) in males.
Comparison of anteroposterior position of maxilla in total sample
When anteroposterior position of maxilla in total sample was compared using SNA angle & Upper centroid position, [Table 2] showed statistically insignificant results (P value -0.701). The coincidence between the two methods in grouping the subjects sagittally is 34.7% of the sample.
|
|
Upper Centroid position |
|
|||||
|
SNA angle |
Orthognathic |
Prognathic |
Retrognathic |
Total |
X2 |
P value |
Cramer’s V test |
|
Orthognathic |
28 |
45 |
24 |
97 |
2.187 |
0.701 |
0.075 |
|
Prognathic |
15 |
31 |
19 |
65 |
|||
|
Retrognathic |
6 |
19 |
9 |
34 |
|||
|
Total |
49 |
95 |
52 |
196 |
When anteroposterior position of maxilla in female and male sample was compared using SNA angle & Upper centroid position showed statistically insignificant results, (P value- 0.373) in females and (P value- 0.109) in males.
Comparison of anteroposterior position of Mandible in Total sample
When anteroposterior position of mandible in total sample was compared using SNB angle & Lower centroid position, ([Table 3]) showed statistically insignificant results (P value- 0.139). The coincidence between the two methods in grouping the subjects sagittally is 36.7% of the sample.
|
|
Lower Centroid position |
|
|||||
|
SNB angle |
Orthognathic |
Prognathic |
Retrognathic |
Total |
X2 |
P value |
Cramer’s V test |
|
Orthognathic |
12 |
75 |
8 |
95 |
6.948 |
0.139 |
0.133 |
|
Prognathic |
3 |
56 |
2 |
61 |
|||
|
Retrognathic |
7 |
29 |
4 |
40 |
|||
|
Total |
22 |
160 |
14 |
196 |
When anteroposterior position of mandible in female and male sample was compared using SNB angle & Lower centroid position, showed statistically insignificant results (P value - 0.699) in females and (P value - 0.198) in males.
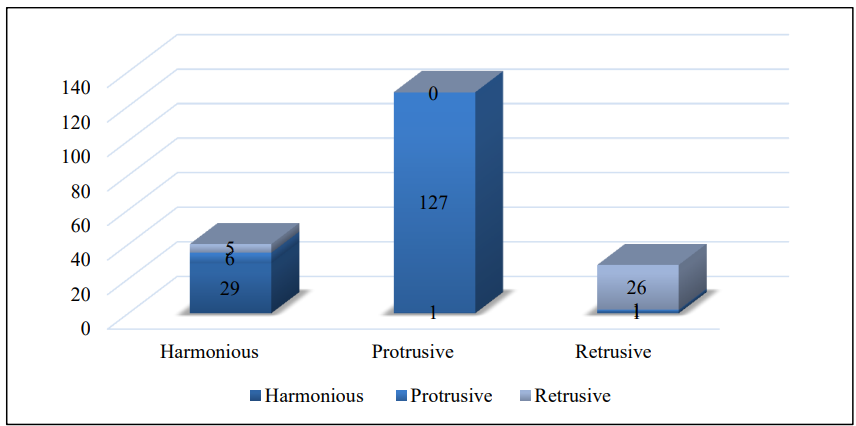
The relationship between angle ANB and CGA in Total sample
When the relationship between maxilla and mandible in total sample was evaluated using angle ANB and Centrographic analysis, [Table 4] showed statistically significant results (P value - 0.001). The coincidence between the two methods in grouping the subjects sagittally is 43.8% of the sample.
|
|
Centrographic Method |
|
|||||
|
Angle ANB |
Sketal Class 1 |
Sketal class 2 |
Sketal class 3 |
Total |
X2 |
P value |
Cramer’s V test |
|
Sketal class 1 |
12 |
12 |
36 |
60 |
18.075 |
0.001 |
0.215 |
|
Sketal class 2 |
13 |
33 |
37 |
83 |
|||
|
Sketal class 3 |
5 |
7 |
41 |
53 |
|||
|
Total |
30 |
52 |
114 |
196 |
When the relationship between maxilla and mandible in female and male sample was evaluated using angle ANB and Centrographic analysis, showed statistically significant results (P value-0.004) in females and statistically insignificant results (P value- 0.148) in males.
The relationship between Wits appraisal and CGA in total sample
When the relationship between maxilla and mandible in total sample was evaluated using Wits appraisal and Centrographic analysis, [Table 5] showed statistically significant results(P value - 0.031). The coincidence between the two methods in grouping the subjects sagittally is 30.1% of the sample.
|
|
Centrographic Method |
|
|||||
|
Wits appraisal |
Sketal Class 1 |
Sketal class 2 |
Sketal class 3 |
Total |
X2 |
P value |
Cramer’s V test |
|
Sketal class 1 |
9 |
13 |
47 |
69 |
10.652 |
0.31 |
0.165 |
|
Sketal class 2 |
20 |
37 |
54 |
111 |
|||
|
Sketal class 3 |
1 |
2 |
13 |
16 |
|||
|
Total |
30 |
52 |
114 |
196 |
When the relationship between maxilla and mandible in female and male sample was evaluated using Wits appraisal and Centrographic analysis, showed statistically insignificant results (P value- 0.125) in females and (P value- 0.193) in males.
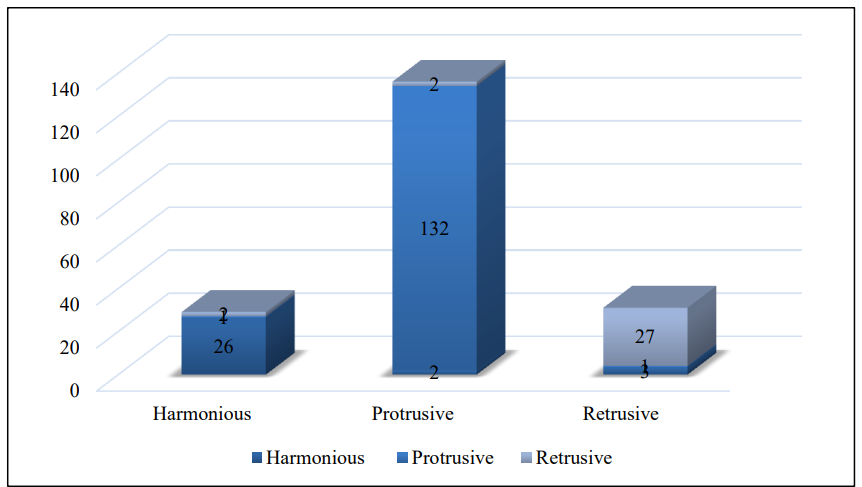
The relationship between Beta angle and CGA in total sample
When the relationship between maxilla and mandible in total sample was evaluated using Beta angle and Centrographic analysis, ([Figure 6]) showed statistically significant results (P value - 0.000). The coincidence between the two methods in grouping the subjects sagittally is 40.8% of the sample.
When the relationship between maxilla and mandible in female and male sample was evaluated using Beta angle and Centrographic analysis, showed statistically significant results (P value- 0.001) in females and (P value- 0.006) in males.
Assessment of soft tissue profile was done in
Total subjects
Female subjects
Male subjects
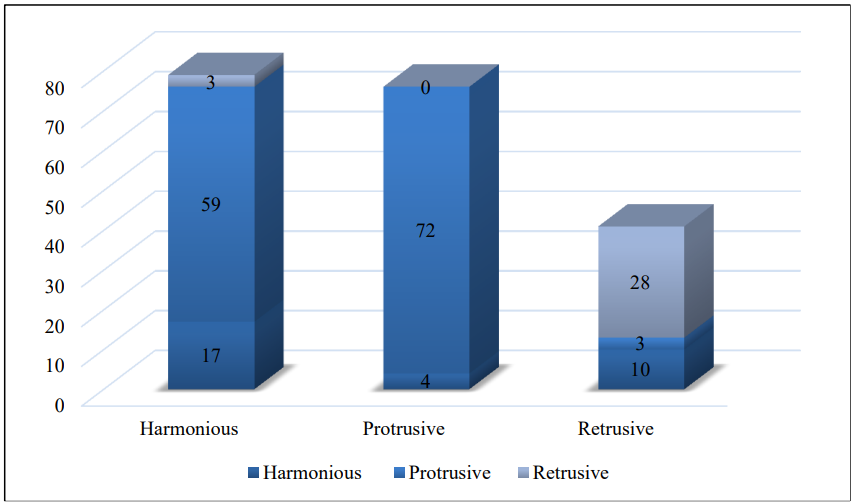
Comparison of upper lip position using S line and centrographic profile planes in total sample
When the position of upper lip in total sample was evaluated using conventional S line and Centrographic profile planes, ([Figure 7]) showed statistically significant results (P value - 0.000). The coincidence between the two methods is 92.8% of the sample.
When the position of upper lip in female and male sample was evaluated using conventional S line and Centrographic profile planes, showed statistically significant results(P value - 0.000) in females and (P value- 0.000) in males.
Comparison of upper lip position using E line and centrographic profile planes in total sample
When the position of upper lip in total sample was evaluated using conventional E line and Centrographic profile planes,([Figure 8]) showed statistically significant results(P value- 0.000). The coincidence between the two methods is 73.5% of the sample.
When the position of upper lip in female and male sample was evaluated using conventional E line and Centrographic profile planes, showed statistically significant results(P value- 0.000) in females and males.
Comparison of lower lip position using S line and centrographic profile planes in total sample
When the position of lower lip in total sample was evaluated using conventional S line and Centrographic profile planes, ([Figure 9]) showed statistically significant results (P value- 0.000). The coincidence between the two methods is 94.3% of the sample.
When the position of lower lip in female and male sample was evaluated using conventional S line and Centrographic profile planes, showed statistically significant results (P value -0.000) in females and males.
Comparison of Lower lip position using E line and Centrographic profile planes in Total sample
When the position of Lower lip in total sample was evaluated using conventional E line and Centrographic profile planes, ([Figure 10]) showed statistically significant results (P value- 0.000). The coincidence between the two methods is 59.6% of the sample.
When the position of Lower lip in female and male sample was evaluated using conventional E line and Centrographic profile planes, showed statistically significant results (P value - .000) in females and males.
Discussion
When diagnosing and arranging orthodontic treatment, centrographic analysis a geometric centroid-oriented, individualised cephalomorphic approach may be taken into consideration. Each patient has a unique reference plane that is used to identify any skeletal or dental disharmonies. [14] The present study was undertaken to evaluate the different facial form assessment concepts i.e. conventional numeric cephalometric approach and geometric centroid oriented individualised cephalometric approach.
Evaluation of skeletal pattern in Sagittal plane
Both cephalometric and centrographic methods were compared in sagittal plane in total sample, female sample and male sample. The following comparisons were done in sagittal plane:
Skeletal Jaw relationship
Position of Maxilla
Position of Mandible
Occlusal classification based on lateral cephalograms include a sagittal classification according to Angle’s for parametric conventional cephalometric analysis and non-parametric centroid plane relationship in Fishman’s[1] centrographic analysis.
Parametric conventional cephalometric analysis is used to study the skeletal relationship between the cranial base and the jaws. The variance in craniofacial physiognomy causes few inherent errors in the cranial reference plane SN. The anterior or posterior placement of the nasion as a result of an abnormally long or short anterior cranial base, or the forward or backward position of the jaws themselves within the cranial complex, will influence the values of the relative spatial relationship of the nasion to the jaw.[15]
In our present study upon comparing the findings of the Centrographic analysis with the findings of angle ANB, Beta angle and Wits appraisal, on an average, in which at least two are in accordance to decide the sagittal relationship, there was a significant statistical relationship in total sample and also when both gender samples were compared individually, but with low association (0.1 to 0.3). The percentage of coincidence between both methods were 41.83%, 40% and 44.4% in total sample, female sample and male sample respectively.
The significant relationship suggests that there is not much agreement between traditional cephalometric analysis and centrographic analysis. This indicates that the two analyses are not fully compatible to arrive at the same diagnosis each time they are used in tandem. Taher and Abd El-Aziz(2007)[16] assessed various patterns of craniofacial growth based on both these methods and found a disagreement between them in reaching a precise diagnosis regarding the anteroposterior facial form, supporting our study in terms of evaluating the sagittal jaw relation. Nehete (2012)[17] discovered that despite the patients' clinically well-balanced face profiles, there was little chance of the upper and lower centroid landing on the centroid plane. Reddy (2015)[2] discovered that the likelihood of the upper and lower centroid coincident with the centroid plane was found to be minimal, even though the study was done on aesthetically beautiful people with a clinically well-balanced facial profile.
On comparing the findings with two given methods for evaluating anteroposterior position of maxilla (upper centroid) with angle SNA and anteroposterior position of mandible (lower centroid) with angle SNB in total sample and also separately in female and male sample, it was found that no significant statistical relationship was found between the findings of upper centroid and SNA angle and between lower centroid and SNB angle in all groups. This is in support of study by Kholy(2018)[18] where he found no statistical significant relationship between the findings of upper centroid and angle SNA and between lower centroid and angle SNB, which indicated disagreement between both methods for evaluation of the anteroposterior position of the maxillary and mandibular skeletal bases. Contrary to our study is the findings of significant differences existing between upper centroid and angle SNA and between lower centroid and angle SNB by Nehete(2012).[17]
On evaluating relationship between centrographic analysis and angle ANB, it was found to be statistically significant in total sample (P = .001), female sample (P = .004) but statistically insignificant in male sample (P = .148). This is supported with study by Nehete(2012)[17] where significant differences existed between position of upper centroid with respect to lower centroid and angle ANB. As already explained, angle ANB is influenced by the position of nasion, which can too contribute to the statistically significant differences between these two.
On comparing upper centroid to lower centroid position with Wits appraisal, showed statistically significant results (P = .031) in total sample, but was statistically insignificant in both female and male samples with coincidence between two methods as 30.1%, 24.3% and 38.2% respectively. The Cramer’s V test showed low association in all the three groups. Nehete (2012)[17] in his study found that significant differences existed between UC- LC (upper centroid-lower centroid) and Wits appraisal. Wits appraisal depends on the position of occlusal plane. Clockwise or counterclockwise rotation of the occlusal plane affects the jaw relation.
On comparing UC-LC (upper centroid-lower centroid) position with Beta angle, showed statistically significant relationship in all sample groups with coincidence of 40.8%, 37.4% and 45.6% between two methods. Cramer’s V test showed low association in all the three groups. This shows inconsistency between two methods in determining anteroposterior skeletal jaw relation. In a study by Sundareswaran (2015)[19] showed that clockwise rotation of the mandible can affect the reliability of Beta angle as a sagittal discrepancy assessment tool. So Beta angle is not a reliable tool for assessment of sagittal jaw discrepancy, especially in patients exhibiting vertical growth patterns with skeletal class I and class II malocclusions.
Both cephalometric and centrographic methods compared in sagittal plane can be interchangeably used for SNA, SNB and ANB for female samples. But, they cannot be used interchangeably for ANB in total sample, Wits and beta angle.
Evaluation of soft tissue
Soft tissue analysis assessed facial esthetics and helps in establishing treatment goals for orthodontics and orthognathic surgery. It determines the stability and success of treatment results. Most researchers, studied the soft tissue cephalometrically and dealt with the lips, nose and chin as a synergistic complex. Steiner [6] and Ricketts [9] numerically developed their soft tissue analysis relating these components to each other in different ways.
In our present study, both upper lip & lower lip position assessed in relation to S line and E line and compared to its position with centrographic profile planes bisector, it was found to be statistically significant. Both the methods showed high association between them in all study sample groups.
Both cephalometric and centrographic methods for upper lip & lower lip position assessed in relation to S line and E line cannot be used interchangeably.
Yagci (2013)[20] conducted a soft tissue study using a centrographic technique approach to assess the postural equilibrium of the lips in the adult Anatolian Turkish population. He discovered that their upper lip is retrusive and their mandible is protruding. In a different study, Reddy et al. (2015) [2] examined the application of centrographic analysis in a pleasing profile sample from Uttar Pradesh. They discovered that although females showed a retrusive lower lip, attractive males showed a more or less properly positioned lower lip. Burstone (1980) [21] showed protruding upper and lower lips in attractive males and females when these people were examined cephalometrically utilising upper and lower lip protrusion linear measurements.
Conclusions
The skeletal pattern of a patient is visually represented graphically using geometric derivation in the centrographic analysis. This geometry is created by using landmarks found in skeletal anatomy. In the present study, to test various notions of facial form assessment, the centroid, or centre of facial areas, was identified and compared with traditional cephalometric analytic criteria.
Following conclusions were drawn from the present study:
Cephalometric measurements, which are group-based norms, and centrographic analysis, which is an individualised method, diverge significantly from one another. Therefore, the null hypothesis was rejected for the current study's assessment of the sagittal plane skeleton-facial morphology in various malocclusion groups.
When evaluating the sagittal jaw relationship, there were statistically significant differences between the two techniques.
The centroid plane was shown to be the least likely location for both the upper and lower centroid to fall.
After examining the soft tissue to determine the upper and lower lip's positional relationship, it was determined that the soft tissue could be examined using the centrographic analysis method. The evaluation of lip balance and harmony was shown to be more consistent with Steiner's S line when compared to centrographic profile planes.
Sexual dimorphism was evident when males and females were compared. Male samples show a statistically non-significant association between the two approaches when examining the sagittal relationship with angle ANB and centrographic analysis, while female samples show a statistically significant relationship.
Regardless of the sagittal skeletal type shown by traditional cephalometric analysis, the class III type of skeletal morphologic pattern is more visible in the anteroposterior plane when studied using centrographic analysis.
Source of Funding
None.
Conflict of Interest
None.
References
- LS Fishman. Discovering the uniqueness of the individual. Am J Orthod Dentofacial Orthop 1991. [Google Scholar]
- C Munish, Reddy. . The applicability of centrographic analysis in pleasing craniofacial phenotype. APOS trends in orthodontics . [Google Scholar]
- J H Johnson, R J Hubbold. An introduction to centroid cephalometrics. Br J Orthod 1982. [Google Scholar]
- R R Riedel. The relation of maxillary structures to cranium in malocclusion and in normal occlusion. Angle Ortho 1952. [Google Scholar]
- CY Baik, M Ververidou. A new approach of assessing sagittal discrepancies: The Beta angle. Am J Orthod Dentofacial Orthop 2004. [Google Scholar]
- CC Steiner. Cephalometrics for you and me. Am J orthod dentofacial orthop 1953. [Google Scholar]
- T Rakosi. . An atlas and manual of cephalometric radiography 1982. [Google Scholar]
- A Jacobson, RL Jacobson. . Radiographic Cephalometry: From basics to video imaging. 1995. [Google Scholar]
- RM Ricketts. Planning treatment on the basis of the facial pattern and as an estimate of its growth. Angle Orthod 1957. [Google Scholar]
- S Farishta, PK Varma, KS Reddy, S Chandra, Z Nanda. Cephalometric evaluation - based on Steiner’s analysis on young adults of Chattisgarh. J Contemp Dent Pract 2011. [Google Scholar]
- C Singh, H Kumar, A Verulkar, R Joshi, H Garg. Norms for antero-posterior assessment of jaw relationship for North Indian population. Indian J Dent Sci 2014. [Google Scholar]
- SP Singh, AK Utreja, AK Jena. Cephalometric norms for orthognathic surgery for north Indian population. Contemp Clin Dent 2013. [Google Scholar]
- LS Fishman. Individualised evaluation of facial form. Am J Orthod & Dentofac Orthop 1997. [Google Scholar]
- MJ Trenouth. The stability of anatomic and centroid reference points in cephalometric analysis. Angle orthod 1989. [Google Scholar]
- A Jacobson. The ‘Wits’ appraisal of jaw disharmony. Am J Orthod Dentofacial Orthop 2003. [Google Scholar]
- F Elasayed, HA Aziz, S Taher. Cephalomorphic versus cephalometric assessment of facial form. J Egypt Dent Assoc 2007. [Google Scholar]
- AB Nehete, PV Hazare. An evaluation of centrographic analysis as compared with conventional cephalometric analysis. J Ind Orthod Soc 2012. [Google Scholar]
- MS El Kholy, AS Ghobashy, MN Fakhry. Applicability of centrographic analysis in evaluation of morphological characteristics of Egyptian adult sample. Tanta Dent J 2018. [Google Scholar]
- S Sundareswaran, V Kumar. Reliability of Beta angle in assessing true anteroposterior apical base discrepancy in different growth patterns. J Nat Sci Biol Med 2015. [Google Scholar]
- A Yagci, SI Ramoglu, T Uysal, AI Karaman, E Ozdiler. Standards of centrographic analysis in an Anatolian Turkish population. Turkish J Orthod 2013. [Google Scholar]
- HL Legan, CJ Burstone. Soft tissue cephalometric analysis for orthognathic surgery. J Oral Surg 1980. [Google Scholar]
- Introduction
- Aim and Objectives
- Materials and Methods
- Analysis assessing sagittal skeletal relationship
- Assessment of sagittal jaw relationship
- Construction of centroid
- Construction of triangles in lateral cephalogram
- Construction of centroid plane
- Soft tissue assessment
- Statistical analysis
- Results
- Assessment of skeletal pattern in sagittal plane was done on
- Comparison of division of total sample sagittally
- Comparison of anteroposterior position of maxilla in total sample
- Comparison of anteroposterior position of Mandible in Total sample
- The relationship between angle ANB and CGA in Total sample
- The relationship between Wits appraisal and CGA in total sample
- The relationship between Beta angle and CGA in total sample
- Assessment of soft tissue profile was done in
- Comparison of upper lip position using S line and centrographic profile planes in total sample
- Comparison of upper lip position using E line and centrographic profile planes in total sample
- Comparison of lower lip position using S line and centrographic profile planes in total sample
- Comparison of Lower lip position using E line and Centrographic profile planes in Total sample
- Discussion
- Conclusions
- Source of Funding
- Conflict of Interest