- Visibility 135 Views
- Downloads 15 Downloads
- DOI 10.18231/j.ijohd.2021.057
-
CrossMark
- Citation
Evaluation of full cup test and numeric pain rating scale in the assessment of orofacial pain
Introduction
French philosopher Simone Weil noted that “Pain is the root of knowledge.[1]” Pain is considered a key symptom associated with possible impairment of oral-health related quality of life.[2] The assessment of the intensity of pain and locating it is a routine method in clinical practice. Several tools have been recognized for different types and subtypes of pain conditions so that the consequence of pain on quality of life and the patient’s function can be gaged. Therefore, pain measurement tools are used to help assess pain intensity, and monitor the effectiveness of and response to treatment decisions.[3]
Materials and Methods
The study included a total of 60 patients with age range of 12-70 years presented with various forms of orofacial pain to our Department of Oral Medicine and Radiology. Young children and adult with communication difficulties, patient with cognitive impairment or delirium were excluded from the study. Data collected included the patient demographic details and the diagnosis of each case was made after proper history taking, clinical examination and radiographic investigation. Pain assessment was done for each patient using numeric pain rating scale and full cup test.
The NRS, which was developed by Downie in 1978, consists of a vertical or horizontal line, with a total of 11 numbers, ranging from 0 to 10, denoting no pain to the worst possible pain, respectively[4] ([Figure 1]). Numeric pain rating scale score 0 cm was categorized as no pain, 1–3 cm mild pain (nagging, annoying, interfering little with activities of daily learning [ADLs]), 4–6 cm moderate pain (interferes significantly with ADLs) and 7–10 cm severe pain (disabling; unable to perform ADLs).[1]
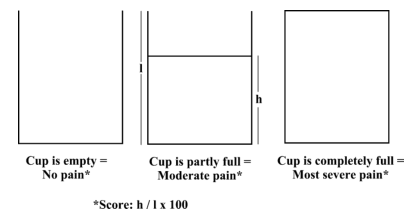
Ergun et al. described the FCT a simple “cup” drawing. The patients were told ‘this cup is completely empty when there is no pain and completely full when your pain is the most severe. And now, how much of this cup is filled by your pain?’ he patients then drew a line on the cup to indicate the level of pain.[5] Full Cup Test score was calculated as follows: Height of line/Height of cup × 100 ([Figure 2]). Maximum score (100%) on FCT was given a value of 10 for easy comparison with NPRS.
Statistical analysis
The collected data was analyzed using the statistical package for social sciences (SPSS), SPSS Inc. Released 2008. SPSS Statistics for Windows, Version 17.0. Chicago. The level of significance was set at P value <0.05. For the purpose of comparing these two scales, the various diagnoses were categorized into acute and chronic pain and the mean pain scores were analyzed.
Results
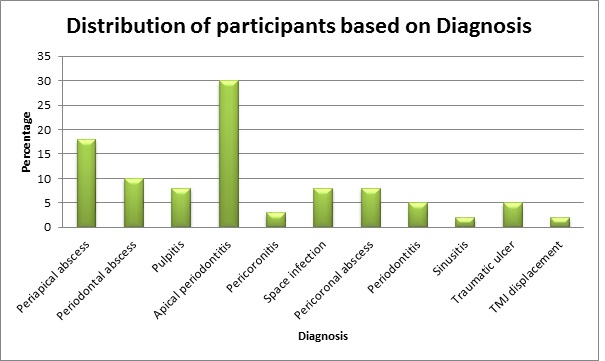
More of the study participants (58%) were in the 21–39 age group, females (78%) and had attained a primary level of education (63%). ([Table 1]). The following were the 5 most frequently diagnosed conditions among the participants; Abscess (periapical, periodontal and pericoronal) and space infection (42%), acute apical periodontitis (30%), pulpitis (8%), chronic periodontitis (5%), pericoronitis (3%) (Graph 1).
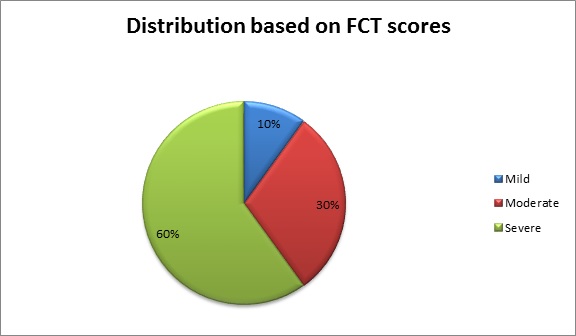
Distribution of participants based on the pain scores using full cup test shows majority (60%) of them were in the severe pain category followed by moderate (30%) and mild pain (10%) respectively ([Figure 3]).
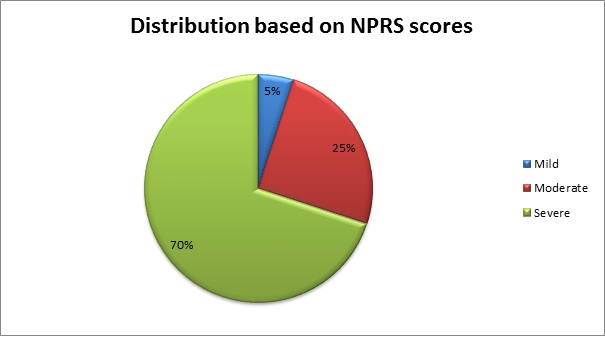
Distribution of participants based on the pain scores using numeric pain rating scale shows majority (70%) of them were in the severe pain category followed by moderate (25%) and mild pain (5%) respectively ([Figure 4]).
The comparison of mean pain scores using full cup test and numeric pain rating scale ([Table 2]) shows there was significant differences between acute and chronic pain with P- value of 0.023 and 0.005 respectively.


|
Characteristics |
Frequency (%) |
|
Age group (in years) |
|
|
14-20 |
3 (50) |
|
21-39 |
35 (58) |
|
40-59 |
18 (30) |
|
60 and above |
4 (7) |
|
Gender |
|
|
Male |
17 (28) |
|
Female |
43 (72) |
|
Highest Level of Education |
|
|
Informal |
6 (10) |
|
Primary |
38 (63) |
|
Secondary |
11 (18) |
|
Tertiary |
6 (10) |
|
Type of Pain |
|
|
Acute |
54 (90) |
|
Chronic |
6 (10) |
|
Characteristics |
Median |
IQR |
Z |
P-value |
|
NPRS |
||||
|
Acute |
8 |
6.7-9 |
-2.78 |
.005 |
|
Chronic |
5 |
3-7 |
||
|
FCT |
||||
|
Acute |
79 |
60-92 |
-2.27 |
.023 |
|
Chronic |
55 |
47.5-61.5 |

Discussion
Pain assessment remains a challenge to medical professionals and received more consideration over the past decade. Irrespective of whether it is acute or chronic, the assessment of pain should be simple and practical. Since the intensity of pain is thought to be one of the primary factors that determine its effect on a human’s overall function and sense, there are many scales to assess pain. Pain intensity is probably the easiest dimension of pain to assess, but it is not easy to interpret the intricacies of the results. Pain scales are based on self-report, observational (behavioral), or physiological data.[1] Pain assessment tools used for self-report can either be unidirectional or multidirectional, although the unidirectional ones are easier to use. Examples of unidirectional pain assessment tools are Visual analogue scales (VAS), Verbal rating scales (VRS), Graphic rating scales, Numerical rating scales, Verbal descriptor scales, Body diagrams, Computer graphic scales, Picture scales and Coin scales.[2] Examples for multidirectional pain assessment tools are McGill Pain Questionnaire (MPQ), Brief Pain Inventory (BPI). Examples of observational scales include PIPP; Neonatal/Infant pain scale, FLACC scale; CHEOPS, and for physiological is the COMFORT scale.[1]
According to Dionne et al., pain assessment tools should be understandable, clinically relevant, closely related to the response of the patient, responsive to change, valid in a variety of pain conditions and its clinical utility should be demonstrable.[6] The validity of any pain measurement scale cannot be determined directly. One aspect of validity is a scale’s agreement with another recognized measurement scale. Another suggested method of assessing validity is by the response of the scale to pharmacologic pain interventions. Additionally, the measuring device should yield repeatable and reliable results.[7]
Simple pain measurement is an important criterion for choosing between rating scales and it has been demonstrated that both patients and physicians prefer NRS or VRS over the VAS for this reason.[8] Numerical Pain Rating Scales have shown high correlations with other pain-assessment tools in several studies. The feasibility of its use and good compliance have also been proven. As it is easily possible to administer NRS verbally, it can be used in telephone interviews.[9] NPRS has major practical advantages in terms of not requiring any physical materials and in terms of widespread acceptance in clinical practice.[1] FCT does not need any numeric or word skills, and is easy to understand and to complete. Thus, it has been suggested to assess the pain in low-educated patients.[5] According to our study both the FCT and NPRS were able to assess and differentiate between acute and chronic pain. And the comparison of the full cup test with the numeric pain rating scale divulges that FCT has 83 percent sensitivity and 94 percent specificity.
Marianne Jensen et al (2011) concluded in his study that the most important choice is not the type of scale per se, but the conditions related to its use, which include: a standardized choice of anchor descriptors, method of administration, time frames, information related to the use of scales, interpretation of cut- offs and clinical significance, and the use of appropriate outcome measures and statistics in clinical trial.[10] The outcome of our study reveals individuals with similar diagnosis have variable level of pain and no dental condition is painless in all cases. The level pain will also depend on whether at the time of presentation there is an acute exacerbation of the chronic pain or not. It will also depend on the individual’s pain threshold. The extent and quality of the damage, the individual’s previous experience of pain and emotional state at the time are the factors which govern the individual’s level of pain.
The downside of this study was the mainstream of the pain conditions evaluated in this study can be clustered together as tooth associated pain, without inclusion of the study participants with other non-dental oral pain, headaches and facial pain. Hence, future upcoming studies are thereby recommended to assess FCT in larger groups of patients with various types of orofacial pain, at the time of presentation and subsequent to the management of the conditions to ascertain its practicality for perceiving changes in pain levels.
Conclusion
The results of our study concluded that majority of the patients who presented with acute or chronic dental conditions may experience moderate to severe level of pain. FCT showed high specificity and sensitivity in comparison with NPRS. Pain is subjective varying from person to person and also depends on the individual’s pain threshold. Henceforth, it is necessary for these tools to quantify pain and their use shall be highly valuable in pain clinics.
Source of Funding
None.
Conflict of Interest
The authors declare no conflict of interest.
References
- P Kumar, L Tripathi. Challenges in pain assessment: Pain intensity scales. Indian J Pain 2014. [Google Scholar]
- ED Odai, AO Ehizele, JE Enabulele. Assessment of pain among a group of Nigerian dental patients. BMC Res Notes 2015. [Google Scholar]
- L Li, X Liu, K Herr. Postoperative pain intensity assessment: a comparison of four scales in Chinese adults. Pain Med 2007. [Google Scholar]
- N Sirintawat, K Sawang. Teeranut Chaiyasamut, and Natthamet Wongsirichat. Pain measurement in oral and maxillofacial surgery. J Dent Anesth Pain Med 2017. [Google Scholar]
- U Ergün, B Say, G Ozer, O Yildirim, O Kocatürk, D Konar. Trial of a new pain assessment tool in patients with low education: the full cup test. Int J Clin Pract 2007. [Google Scholar]
- RA Dionne, L Bartoshuk, J Mogil, J Witter. Individual responder analysis for pain: does one pain scale it all?. Trends Pharmacol Sci 2005. [Google Scholar]
- K Isik, A Unsal, A Kalayci, E Durmus. Comparison of three pain scales after impacted third molar surgery. Oral Surg Oral Med Oral Pathol Oral Radiol Endod 2011. [Google Scholar]
- EK Breivik, GA Bjornsson, E Skovlund. A comparison of pain rating scales by sampling from clinical trial data. Clin J Pain 2000. [Google Scholar]
- M Haefeli, A Elfering. Pain assessment. Eur Spine J 2006. [Google Scholar]
- MJ Hjermstad, PM Fayers, DF Haugen, A Caraceni, GW Hanks, JH Loge. Studies comparing numerical rating scales, verbal rating scales, and visual analogue scales for assessment of pain intensity in adults: A systematic literature review. J Pain Symptom Manage 2011. [Google Scholar]
